

The Same Site, Two Prices: What 40,749 Publisher Quotes Say About Guest Post Pricing
Ask five people in link building what a guest post should cost, and you'll get five different numbers, usually with total confidence attached to each one. That's not because nobody's collected the data. Several large platforms have published serious pricing studies pulled from hundreds of thousands of live listings. The numbers just don't agree with each other, and none of them explain why.
We think we know why, and it isn't a sampling problem. It's that every published study so far has treated a guest post the way you'd treat a commodity, one product, one going rate, adjustable for quality. But a guest post isn't sold by a single seller. The same domain gets resold, marked up, and re-quoted by multiple sellers at once, and nobody had checked what happens when you catch the same site being sold twice. We had the data to check it, so we did.
Here's the headline number: take 3,583 websites with a Domain Rating between 50 and 59, the same authority band, by any tool you use to check it. The cheapest 5% of sellers in that band will do a guest post for $14. The most expensive 5% will charge $845. Same band, same metric, a sixty-fold gap in what you'd pay.
That's not a fluke of one niche or one seller. It shows up across the entire market, and it's the reason we built this study instead of publishing another "average guest post price" report. Below, we break down what actually drives guest post pricing, why Domain Rating is a weaker predictor than most buyers assume, and, using 736 domains we caught being quoted by more than one seller, just how wide the same-site price gap really is.
Why We Didn't Publish an Average
"How much does a guest post cost" is one of the most heavily covered questions in link building, and the existing answers come from serious sample sizes. Sellers surveying hundreds of thousands of live listings put the going rate somewhere in the low-to-mid hundreds of dollars, and traffic, more than authority scores, tends to come out as the strongest single price driver in that kind of analysis. One widely cited breakdown of over a million marketplace offers even said the quiet part out loud: correlations between price and quality metrics stay weak across the board, and pricing is, in their words, still largely arbitrary. Then it stopped there.
Publishing another headline average wouldn't add anything to that pile, and it would put us behind several much larger, much older domains making the same point with the same kind of data. So we asked a different question: what happens when you check the same site against more than one seller? None of the existing studies can answer that, because none of them price the same domain twice. We can, because our sourcing files already contain overlapping quotes for the same domains pulled from different price sheets. That overlap is the part of this market nobody else's methodology can see, and it's what the rest of this post is built on.
What We Analyzed, and What We Didn't
Two datasets, both pulled from our own sourcing and pricing files on 4 September 2026:
40,749 priced publisher records, each with an asking price, a Domain Rating, and organic traffic figure attached.
20 wholesale price sheets covering 6,661 distinct domains, of which 736 domains appear on two or more sheets at different prices.
A few things worth being upfront about, because they shape how far these numbers should be trusted:
Every figure here is an asking price, what a seller lists or quotes, not a confirmed transacted price. Sellers negotiate, and the price two buyers actually pay for the same listing can differ from what's shown. We're measuring the spread in what the market quotes, which is itself the finding, but it isn't the same claim as "what people paid."
This inventory skews mid-market. It's the tier most working SEOs and agencies actually buy from day to day, not the small number of five- and six-figure placements on national mastheads. If your budget lives exclusively in that top tier, the medians below will look low to you, and that's exactly the point the data is making.
And one metric was cut entirely: an early pass at this dataset showed Moz Domain Authority correlating negatively with price. That's not a market insight, it's almost certainly a stale or dirty column, and we're not going to publish a finding built on data we don't trust yet. When it's been re-pulled and verified, it may be worth its own post. It isn't part of this one.
What a Guest Post Actually Costs: Median $35, Mean $174
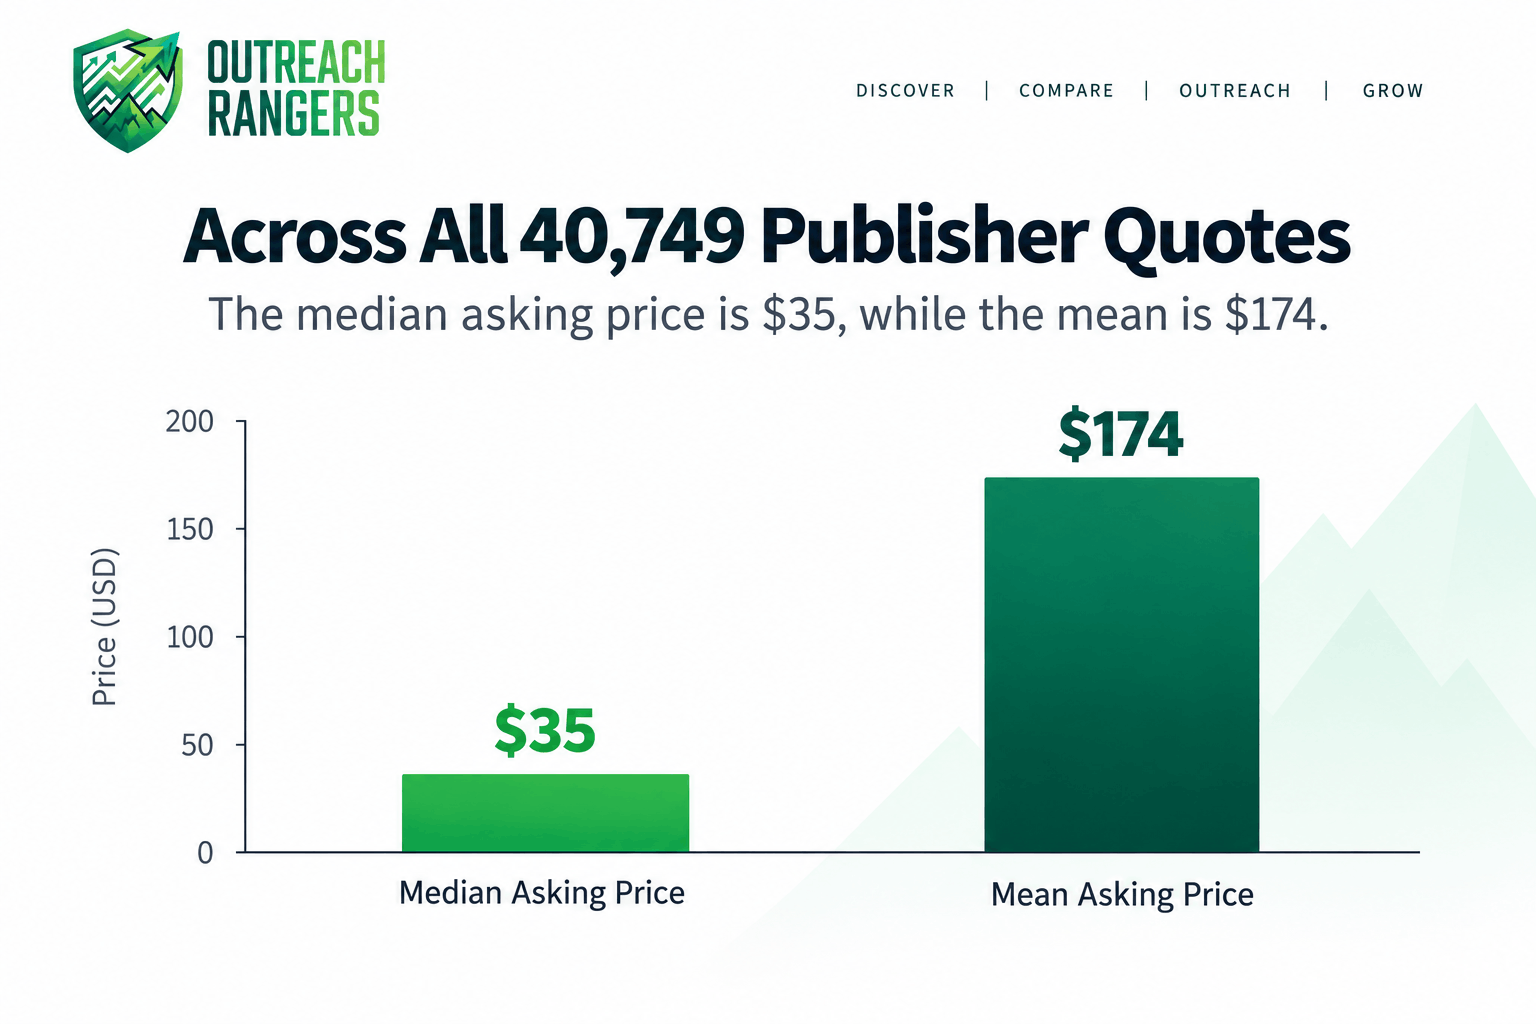
Across all 40,749 priced records, the median asking price is $35. The mean is $174, roughly five times higher.
That gap is the whole story in miniature. A thin tail of expensive placements, mostly on high-authority news and business sites, pulls the average up far past what a typical listing costs. Reports that lead with an average in the hundreds of dollars aren't wrong about their own sample, they're describing that tail, not the market most buyers are actually shopping in. If you've been benchmarking your link-building budget against a "$400 average guest post," you've been benchmarking against the exception, not the rule.
This is also, to be clear, a point of genuine disagreement with some of the bigger names in this space, and we'd rather say that directly than bury it. Different marketplaces pull from different supply, and a platform sourcing more heavily from premium or curated inventory will naturally show a higher central price than one indexing a wider, messier long tail. Both numbers can be true of their own datasets. Ours says: if you're buying broadly across the market rather than exclusively at the top of it, $35 is a far more useful anchor than $400.
Price Barely Tracks Domain Rating And the Chart That Shows It
Here's the number that should change how you filter a marketplace: the correlation between asking price and Domain Rating across all 40,749 records is 0.37 (Spearman's rank correlation). Organic traffic does noticeably better, at 0.56.
Neither is a strong relationship. But the gap between them matters: if you're sorting a marketplace by DR and treating it as a proxy for what a link is worth, you're anchoring on the weaker of two signals we can measure directly, and ignoring the stronger one.
The table below breaks the full dataset into DR bands and shows the asking-price distribution inside each one.
DR band | Sites | 25th pct | Median | 75th pct | Cheapest | Most expensive |
0–9 | 11,057 | $11 | $18 | $35 | $4 | $3,823 |
10–19 | 5,683 | $14 | $35 | $150 | $4 | $3,436 |
20–29 | 6,667 | $14 | $35 | $159 | $4 | $4,534 |
30–39 | 6,220 | $14 | $52 | $195 | $6 | $8,667 |
40–49 | 3,960 | $28 | $95 | $221 | $8 | $6,327 |
50–59 | 3,583 | $32 | $98 | $234 | $6 | $5,648 |
60–69 | 1,527 | $53 | $176 | $437 | $8 | $7,641 |
70–79 | 1,440 | $135 | $388 | $1,001 | $8 | $11,888 |
80–100 | 612 | $65 | $341 | $1,726 | $8 | $126,064 |
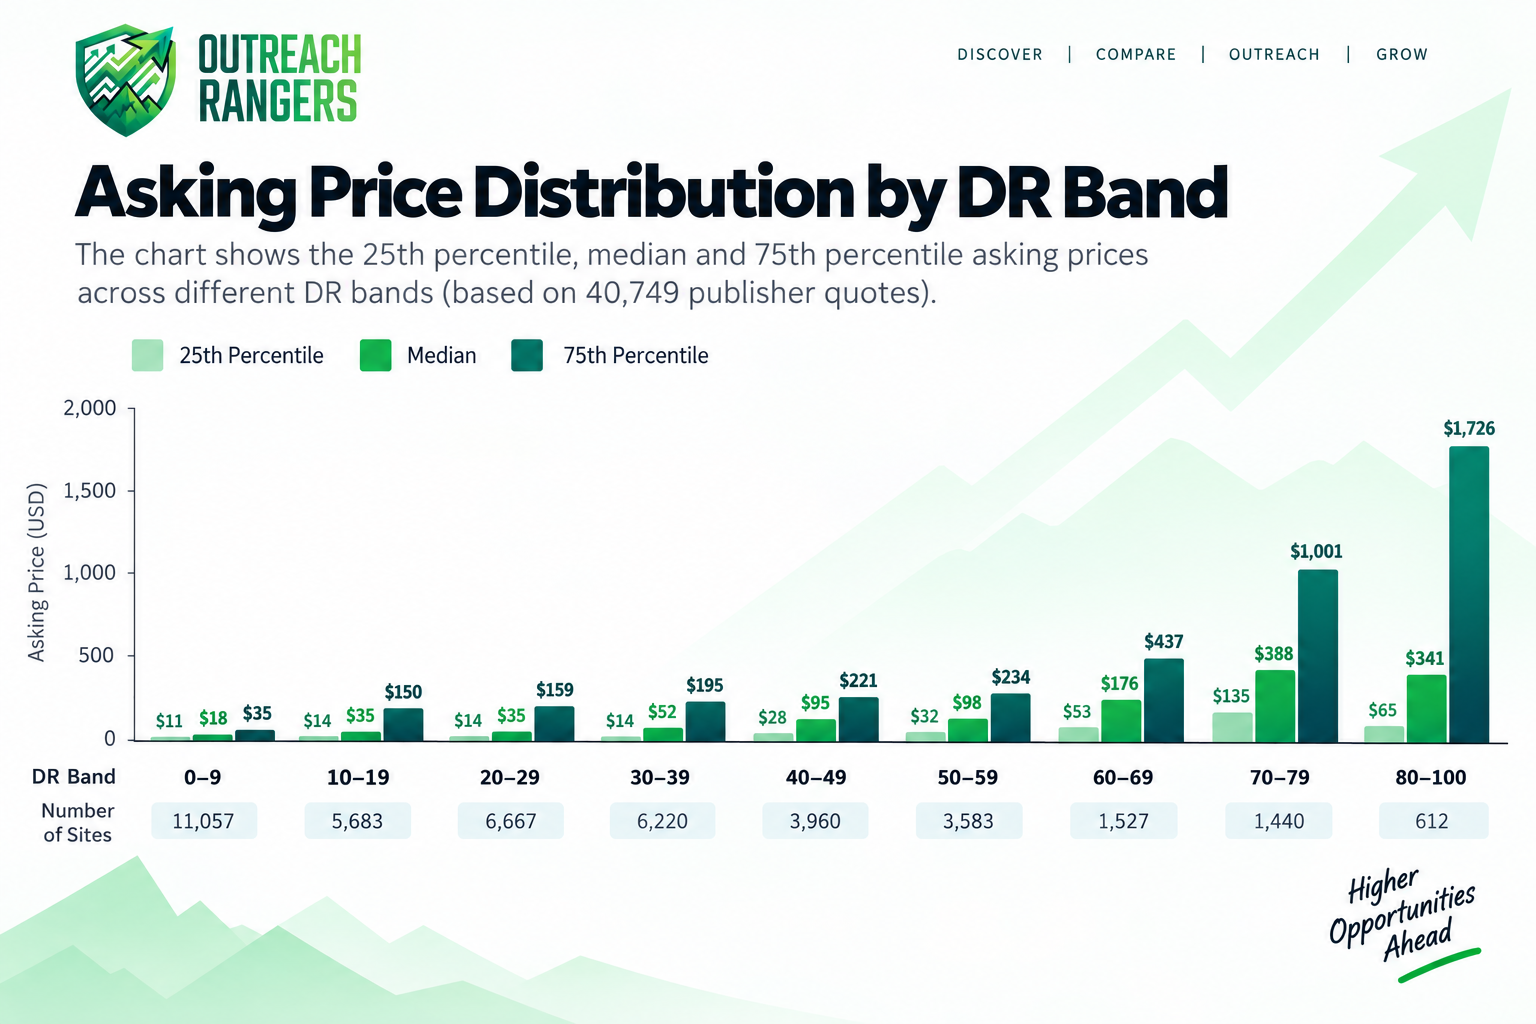
Two things stand out. First, the bands overlap heavily from DR 10 through DR 59; a DR 15 site and a DR 55 site are routinely sold for the same money, and the 75th-percentile price in the DR 20-29 band ($159) is close to the median price in the DR 60-69 band ($176). Second, the DR 80-100 row's median ($341) actually sits below the DR 70-79 row's median ($388), a real inversion in our data, not a typo. The likely explanation is that the very top DR band is a mix of two very different kinds of sites: genuine national press outlets and cheap, high-authority platform pages that carry the DR score without the editorial weight.
The Same Site, Two Prices
This is the part of the study nobody else's data can show, because it depends on catching the same domain quoted more than once.
Of the 6,661 distinct domains across our 20 wholesale price sheets, 736 were quoted by two or more different sellers. Comparing the cheapest and most expensive quote for each of those domains:
The median gap between the two quotes was 2.5×.
The worst case was 14× - the same domain, quoted more than fourteen times higher by one seller than another.
Only 3.5% of double-listed domains were priced identically across sellers.
78% showed a gap of 2× or more.
Price gap between sellers | Share of double-listed domains |
Identical (1×) | 3.5% |
Under 2× | 18.5% |
2× to 3× | 48.2% |
3× or more | 29.8% |
A few anonymized examples pulled directly from the overlap (site identities and seller names withheld, this data comes from our own supply relationships and isn't something we're going to expose):
A DR 44 general/lifestyle site, quoted $20 by one seller and $90 by another in the same week.
A DR 31 business site, quoted $45 and $310, a near-7× spread.
A DR 58 news/media site, quoted $35 and $500.
None of this means anyone is being dishonest. It means the market for a given placement isn't one price, it's a range that depends entirely on which seller happens to be reselling it, and by how much. If you've only ever gotten one quote on a domain, you have no way of knowing where in that range you landed.
Both Directions of Mispricing
The DR-versus-price mismatch doesn't just create noise, it creates predictable mispricing in both directions.
494 sites rated DR 60 or higher are selling for $30 or less. On paper, these are bargains relative to their authority score.
3,910 sites rated DR 20 or below are selling for $100 or more, buyers paying premium prices for comparatively low-authority inventory.
Put plainly: if you're buying primarily on DR without a second data point, you are very likely overpaying somewhere in your campaign, and very likely walking past cheaper high-authority options at the same time. Neither error shows up unless you're checking price against more than one metric and, where possible, against more than one quote.
A Five-Check Pricing Sanity Test
If you take one thing from this study into your next order, make it this checklist. Each check is backed by a number above.
Check traffic before DR. Traffic correlated with price more than twice as strongly as DR did (0.56 vs. 0.37); it's the better available signal of what a listing should cost.
Get a second quote on anything over $100. At that price point, you're well past the market median ($35), and 78% of domains we could check twice showed a 2×-or-greater gap between sellers.
Treat category and niche as a price input, not an afterthought. DR bands overlap so heavily in the middle of the market that authority alone won't explain most of what you're being charged.
Ask what markup you're paying. A near-14× spread existed on at least one domain in our sample. You are not always buying direct from the publisher, and the gap between wholesale and resale can be enormous.
Confirm the site has published real content in the last 90 days. A DR score describes link equity accumulated over time, not whether the site is still an active, editorially maintained publication today.
The Bottom Line
The honest summary of this data is that guest post pricing isn't really a pricing model, it's a negotiation that happens to produce a number. Domain Rating, the metric most buyers filter by first, explains barely more of the variance than a coin flip would improve on. Traffic does better, but even that leaves most of the spread unaccounted for. And the clearest evidence that "price" isn't a fixed property of a site at all is the simplest one: the same domain, quoted by two different sellers in the same week, can come back 2×, 7×, even 14× apart.
None of that means the market is broken or that anyone's acting in bad faith. It means price, on its own, tells you almost nothing about what you're buying until you've checked it against at least one other number, traffic, a second quote, or both. The five checks above aren't a workaround for a messy market; they're what "doing due diligence" actually looks like once you know the average is hiding this much spread underneath it.
We'll keep this dataset current and revisit these numbers as our inventory grows, because a study like this is only as useful as how recently it was run.
FAQs
Q: What is the average cost of a guest post?
A: Across 40,749 priced listings, the median asking price was $35, while the mean was $174. The mean is pulled much higher by a thin tail of expensive placements on high-authority sites, so the median is a more realistic benchmark for typical mid-market buying.
Q: Is Domain Rating (DR) a reliable way to judge guest post pricing?
A: Not on its own. DR correlated with price at only 0.37 (Spearman's rank correlation), a weak relationship. Organic traffic correlated more strongly at 0.56, making it a better single signal though neither metric explains most of the price variation by itself.
Q: Why do prices vary so much for sites with similar DR scores?
A: DR bands overlap heavily through the middle of the market. For example, the 75th-percentile price in the DR 20–29 band was close to the median price in the DR 60–69 band. Niche, traffic, editorial activity, and seller markup all factor in DR alone doesn't capture them.
Q: Can the same website really be sold at very different prices?
A: Yes. Of 736 domains found listed by more than one seller, the median price gap between the cheapest and most expensive quote was 2.5×, and the widest gap observed was 14×. Only 3.5% of double-listed domains were priced identically across sellers.
Q: Should I always get a second quote before buying a guest post?
A: It's strongly advisable, especially above $100. That price point is already well past the market median, and 78% of domains checked against multiple sellers showed a price gap of 2× or more.
Q: Are high-DR sites always worth a premium price?
A: Not necessarily. The study found 494 sites rated DR 60+ selling for $30 or less, and conversely, 3,910 sites rated DR 20 or below selling for $100 or more meaning buyers can both overpay for low-authority inventory and miss underpriced high-authority options if they rely on DR alone.
Q: What should I check before paying for a guest post?
A: The study recommends five checks: prioritize traffic over DR, get a second quote on anything over $100, weigh niche/category rather than DR alone, ask about markup versus direct publisher pricing, and confirm the site has published real content within the last 90 days.
Q: How current is this pricing data?
A: The datasets were pulled directly from sourcing and pricing files on September 4, 2026. Outreach Rangers intends to refresh this analysis periodically as its inventory grows, since guest post pricing shifts over time.
Disclaimer
The figures in this study reflect asking prices from Outreach Rangers' internal sourcing and pricing files as of September 4, 2026, and are not confirmed transaction prices. Actual costs can vary through negotiation and seller terms. The dataset skews mid-market and excludes one unverified metric (Moz DA). Site and seller identities in the pricing examples are withheld to protect confidential supply relationships. For pricing on a specific niche or campaign, talk to our team rather than relying on these averages alone.